shawn110975
Suspended
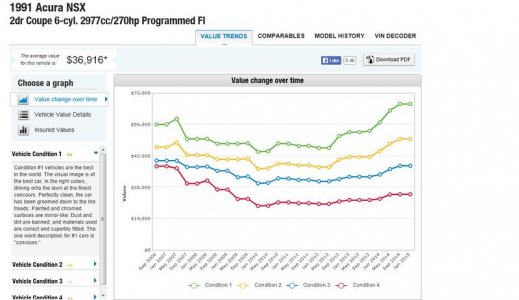
guys earlier this month or possibly a few months ago someone posted a graph they made with given data of prices since 2000 or something like that, and there was a great dip in price almost touching the 20K mark then it steady rose to current to-date pricing.
this graph is what I am looking for, a buddy of mine got rear ended and the other guys insurance company is going to try and screw him saying current market value for a high mile NSX is low and I think this graph will help him fight the " MAN " LOL
I need this ASAP. if you guys could just post it in this thread for future searches it would help greatly in the restoring of his beloved NSX.
thanks in advance.
Shawn


