• Protip: Profile posts are public! Use Conversations to message other members privately. Everyone can see the content of a profile post.

Price analysis of 1991 to 2000 asking prices

Joined
11 August 2004
Messages
36
I analyzed the 140 NSXs on www.autotrader.com to get a price vs. year "curve" to analyze the validity of some of the asking prices.

Methods: 140 NSXs placed into Excel spreadsheet between model years 1991 and 2000.
Salvagable wrecks not included in price
Two cars removed for VERY high asking prices more than two standard deviations above the mean (dealer with very high BUY IT NOW price, but taking bids)
No distinctions/calculations based on mileage, transmission, condition, color, mods or added equipment. (Maybe on a different graph in the future). These are asking prices only and do not reflect the final sales price.

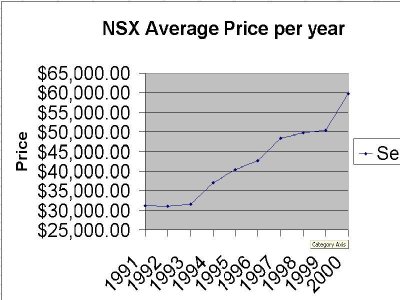
Analysis: There is a statistical correlation between year and price. Of note, almost no difference in average price of 1991, 1992, and 1993. The years 1994 and 1997 show a price jump of nearly $5,000 and the 2000 model year shows a price jump of $10,000 over the 1999 model.
These price jumps sequester the models into price "groups" of
1991 - 1993
1994 - 1996
1997 - 1999
2000

Average asking prices
1991 1992 1993
$31,194.89, $31,017.74, $31,499.91

1994 1995 1996
$36,982.80 $40,365.94 $42,689.09

1997 1998 1999
$48,423.75 $49,698.75 $50,374.50

2000
$59,837.14

I cannot attach the Excel spreadsheet because it is an "invalid extension", but I can PM anyone who wants one so they can look at the raw data and the graphs.

Hope this small analysis helps anyone looking to buy a car or sell.

Doc Rings
 
Last edited:
That's interesting. About the only thing I find surprising here is the jump in price for 1994, since it is almost identical to the 1993. I would have expected most of the jump from 1993 to 1995 to take place for 1995 (due to the removable roof) rather than 1994. And that could be due to thin data.

I assume you did not include current bid prices of cars up for auction (eBay) where the auction has not yet closed...
 
Probably the idea of the latest lighter coupe with all the problem sorted out and the 7-spoke wheels helps the price to be higher. It is the perfect year for the first gen. NSX.

Furthermore now the Brookland Green is maybe more sought than it was before (it is selling well in "british" cars ;) like the Elise and the Mini2).
 
Re: Re: Price analysis of 1991 to 2000 asking prices

PHOEN$X said:
Very cool! I wonder if the slight price dip from 91 to 92 is due to the snap ring issue.
More likely, it's due to thin data. When you have a VERY small number of cars in your sample, even a single car can cause significant fluctuations in the average.
 
Re: Re: Re: Price analysis of 1991 to 2000 asking prices

nsxtasy said:
More likely, it's due to thin data. When you have a VERY small number of cars in your sample, even a single car can cause significant fluctuations in the average.

I would tend to agree.

FWIW, I see little difference between 91s and 92s, but the 93s are usually priced closer to the 94s than the 91s/92s.
 
Re: Re: Re: Price analysis of 1991 to 2000 asking prices

nsxtasy said:
More likely, it's due to thin data. When you have a VERY small number of cars in your sample, even a single car can cause significant fluctuations in the average.
Yeah, I thought it might be due to the small data sample too. Makes sense.
 
The 1991 - 1993 years actually had the most data points.
1991 : 36 cars
1992: 11 cars
1993: 19 cars

With the model years 1997-99 the least (4 each).

2000 year saw a bump in numbers (22 cars), perhaps due to cars coming off loans or out of warranty/trade-ins to dealers?


Here's a link to the file (my wife's business website) so you can peruse the raw data (with it's obvious limitations stated in the first post).

http://www.sandiegoscrubs.com/files/NSX Prices_edited outliers.xls

It should open in most excel programs, and the data is interesting to see in graphical format.

Doc R
 
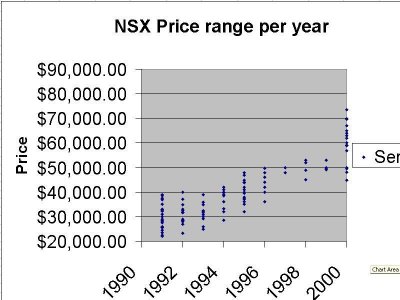
If you look at the graph, you can see there are four 2000 NSX's for sale at the $45K to $49.5K marks: this is the same price as a few 1996 models, and a couple of very low mileage "dealer retail priced" 1995 cars.
Of course, these 2000's may have more mileage, more paint chips, etc. But there is some overlap in prices and for someone who wants a 2000 model year that may or may not need a little *TLC*, its nice to know one can be had for a price that is in the range of the 95's - '97s -- if one is patient and willing to wait for the right car at the right price.

Doc R
 
Difficulty also arises in dealing with the various levels of modifications on these cars. While minor mods are to be expected, including data from turbocharged or supercharged cars, or cars built for track purposes, is going to distort the result
 
True... the mods, and what owners think they are worth, will go into elevating the prices. Hopefully, but I didn't look, there are a scattering of "modded/higher priced" cars in all year groups (but not necessarily so.) That's why the average trend is more useful overall.
BUT, for someone who has a fixed amount of money, looking at the lower prices of each year group can glean some budget beauties, too, and for some years (1991 to 1993) a newer model year for no extra money (on average). For instance, the least expensive 2000 can be had for the just a bit above the "average" asking price of the 1996 model year.

Doc R
 
Last edited:
Average NSX asking price graph

Graph from the Spreadsheet....
 

Attachments

  • nsxpriceaverage.jpg
    nsxpriceaverage.jpg
    72.1 KB · Views: 310
Asking price "range" graph

Asking Price range graph...
 

Attachments

  • nsxpricerange.jpg
    nsxpricerange.jpg
    62.4 KB · Views: 286
Back
Top