- Joined
- 11 August 2004
- Messages
- 36
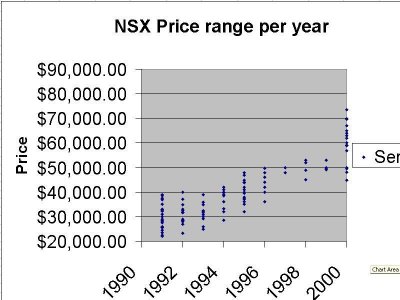
I analyzed the 140 NSXs on www.autotrader.com to get a price vs. year "curve" to analyze the validity of some of the asking prices.
Methods: 140 NSXs placed into Excel spreadsheet between model years 1991 and 2000.
Salvagable wrecks not included in price
Two cars removed for VERY high asking prices more than two standard deviations above the mean (dealer with very high BUY IT NOW price, but taking bids)
No distinctions/calculations based on mileage, transmission, condition, color, mods or added equipment. (Maybe on a different graph in the future). These are asking prices only and do not reflect the final sales price.
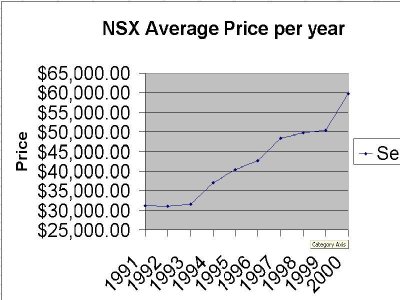
Analysis: There is a statistical correlation between year and price. Of note, almost no difference in average price of 1991, 1992, and 1993. The years 1994 and 1997 show a price jump of nearly $5,000 and the 2000 model year shows a price jump of $10,000 over the 1999 model.
These price jumps sequester the models into price "groups" of
1991 - 1993
1994 - 1996
1997 - 1999
2000
Average asking prices
1991 1992 1993
$31,194.89, $31,017.74, $31,499.91
1994 1995 1996
$36,982.80 $40,365.94 $42,689.09
1997 1998 1999
$48,423.75 $49,698.75 $50,374.50
2000
$59,837.14
I cannot attach the Excel spreadsheet because it is an "invalid extension", but I can PM anyone who wants one so they can look at the raw data and the graphs.
Hope this small analysis helps anyone looking to buy a car or sell.
Doc Rings
Methods: 140 NSXs placed into Excel spreadsheet between model years 1991 and 2000.
Salvagable wrecks not included in price
Two cars removed for VERY high asking prices more than two standard deviations above the mean (dealer with very high BUY IT NOW price, but taking bids)
No distinctions/calculations based on mileage, transmission, condition, color, mods or added equipment. (Maybe on a different graph in the future). These are asking prices only and do not reflect the final sales price.
Analysis: There is a statistical correlation between year and price. Of note, almost no difference in average price of 1991, 1992, and 1993. The years 1994 and 1997 show a price jump of nearly $5,000 and the 2000 model year shows a price jump of $10,000 over the 1999 model.
These price jumps sequester the models into price "groups" of
1991 - 1993
1994 - 1996
1997 - 1999
2000
Average asking prices
1991 1992 1993
$31,194.89, $31,017.74, $31,499.91
1994 1995 1996
$36,982.80 $40,365.94 $42,689.09
1997 1998 1999
$48,423.75 $49,698.75 $50,374.50
2000
$59,837.14
I cannot attach the Excel spreadsheet because it is an "invalid extension", but I can PM anyone who wants one so they can look at the raw data and the graphs.
Hope this small analysis helps anyone looking to buy a car or sell.
Doc Rings
Last edited:
") like the Elise and the Mini2).
like the Elise and the Mini2).